Petroleum Reservoir Evaluation and Development ›› 2024, Vol. 14 ›› Issue (1): 138-150.doi: 10.13809/j.cnki.cn32-1825/te.2024.01.019
• Comprehensive Research • Previous Articles Next Articles
GUO Zhidong1( ),KANG Yili2(),WANG Yubin1,GU Linjiao3,YOU Lijun2,CHEN Mingjun2,YAN Maoling2
Received:2023-07-12
Online:2024-02-26
Published:2024-03-05
CLC Number:
GUO Zhidong, KANG Yili, WANG Yubin, GU Linjiao, YOU Lijun, CHEN Mingjun, YAN Maoling. Gas-water relative permeability characteristics and production dynamic response of low pressure and high water cut tight gas reservoirs[J].Petroleum Reservoir Evaluation and Development, 2024, 14(1): 138-150.
Table 1
Classification and evaluation basis of tight sandstone reservoirs in Ordos Basin"
| 类型 | 孔隙度/% | 渗透率/10-3 μm2 | 中值半径/μm | 排驱压力/MPa | 最大孔喉半径/μm | 分选 系数 |
|---|---|---|---|---|---|---|
| Ⅰ类 | >12 | >1.0 | >0.20 | <0.5 | >1.5 | <1.5 |
| Ⅱ类 | 6~12 | 0.1~1.0 | 0.05~0.20 | 0.5~1.5 | 0.5~1.5 | 1.5~2.5 |
| Ⅲ类 | <6 | <0.1 | <0.05 | >1.5 | <0.5 | >2.5 |
Table 2
Basic physical parameters of core in gas-water relative permeability experiment of DJ block"
| 样号 | 长度/cm | 直径/cm | 孔隙度/% | 渗透率/10-3 μm2 | 类型 |
|---|---|---|---|---|---|
| DJ-1 | 5.12 | 2.51 | 8.39 | 9.65 | Ⅰ |
| DJ-2 | 4.94 | 2.52 | 9.90 | 1.40 | |
| DJ-3 | 5.12 | 2.51 | 11.73 | 1.87 | |
| DJ-4 | 5.13 | 2.53 | 15.90 | 0.33 | Ⅱ |
| DJ-5 | 4.88 | 2.51 | 8.69 | 0.45 | |
| DJ-6 | 5.06 | 2.51 | 8.07 | 0.45 | |
| DJ-7 | 4.94 | 2.51 | 7.56 | 0.15 | Ⅲ |
| DJ-8 | 5.04 | 2.52 | 5.81 | 0.19 | |
| DJ-9 | 5.11 | 2.51 | 5.80 | 0.15 |
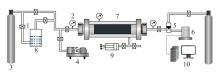
Fig. 1
Flow chart of unsteady gas-water relative permeability experimental apparatus"
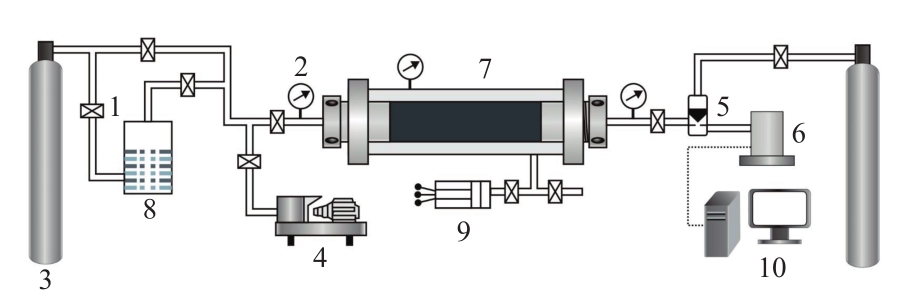
Fig. 2
Gas-water relative permeability curve of experimental cores in DJ block"
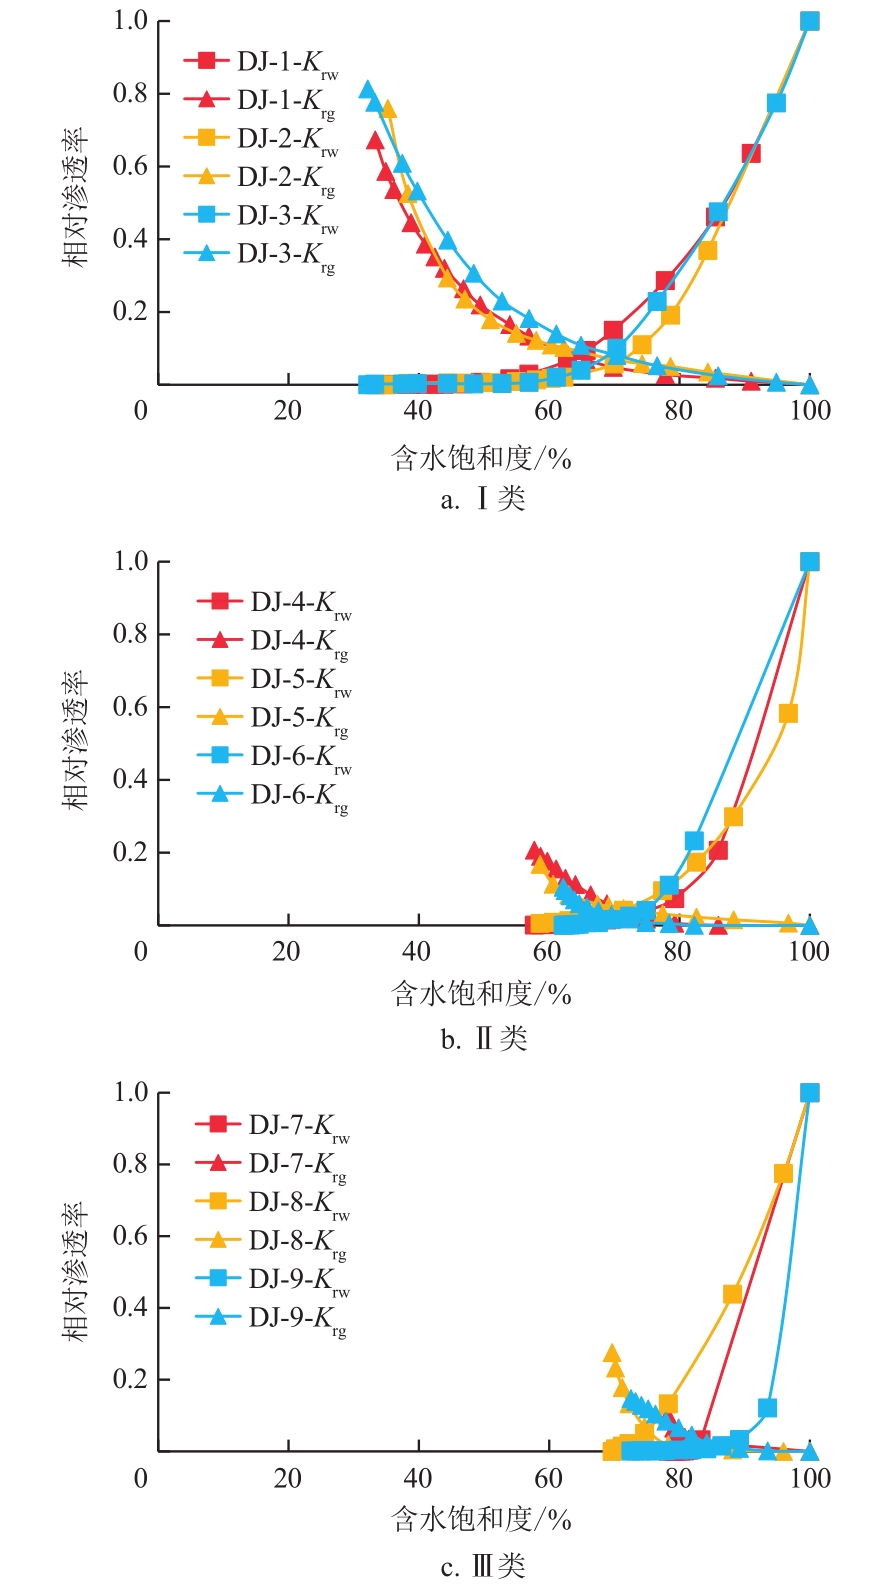
Table 3
Changes of characteristic parameters corresponding to irreducible water saturation of experimental core in DJ block"
| 样号 | 孔隙度/ % | 渗透率/ 10-3 μm2 | 束缚水 饱和度/% | 束缚水气相 相对渗透率 |
|---|---|---|---|---|
| DJ-1 | 8.39 | 9.52 | 33.30 | 0.67 |
| DJ-2 | 9.90 | 1.38 | 40.46 | 0.57 |
| DJ-3 | 11.73 | 1.85 | 39.26 | 0.52 |
| DJ-4 | 15.90 | 0.33 | 57.32 | 0.21 |
| DJ-5 | 8.69 | 0.44 | 58.11 | 0.18 |
| DJ-6 | 8.07 | 0.45 | 69.65 | 0.28 |
| DJ-7 | 7.56 | 0.15 | 78.01 | 0.10 |
| DJ-8 | 5.81 | 0.19 | 69.65 | 0.28 |
| DJ-9 | 5.80 | 0.15 | 70.17 | 0.04 |
Table 4
XRD results of gas-water relative permeability experimental cores in DJ block 单位:%"
| 样号 | 石英含量 | 斜长石含量 | 方解石含量 | 菱铁矿含量 | 黏土矿物含量 | 伊利石含量 | 高岭石含量 | 绿泥石含量 | 类型 |
|---|---|---|---|---|---|---|---|---|---|
| DJ-1 | 81 | 5 | 1 | 0 | 13 | 14 | 10 | 30 | Ⅰ |
| DJ-2 | 59 | 35 | 1 | 0 | 5 | 23 | 49 | 17 | |
| DJ-3 | 90 | 2 | 1 | 0 | 7 | 34 | 49 | 17 | |
| DJ-4 | 76 | 0 | 8 | 3 | 13 | 56 | 28 | 10 | Ⅱ |
| DJ-5 | 59 | 4 | 1 | 0 | 21 | 45 | 17 | 8 | |
| DJ-6 | 62 | 0 | 1 | 2 | 17 | 70 | 23 | 7 | |
| DJ-7 | 39 | 10 | 2 | 6 | 43 | 29 | 3 | 5 | Ⅲ |
| DJ-8 | 30 | 3 | 0 | 14 | 53 | 76 | 19 | 5 | |
| DJ-9 | 59 | 6 | 10 | 0 | 20 | 60 | 24 | 7 |
Fig. 3
Clay mineral analysis of gas-water relative permeability experimental core in DJ block"

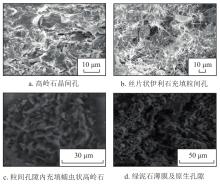
Fig. 4
Microscopic characteristics of clay minerals in core of gas-water relative permeability experiment in DJ block"

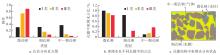
Fig. 5
Fluid distribution of tight sandstone matrix reservoir in DJ block under irreducible water condition"

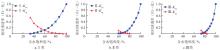
Fig. 6
Three types of normalized gas-water relative permeability curves in DJ block"
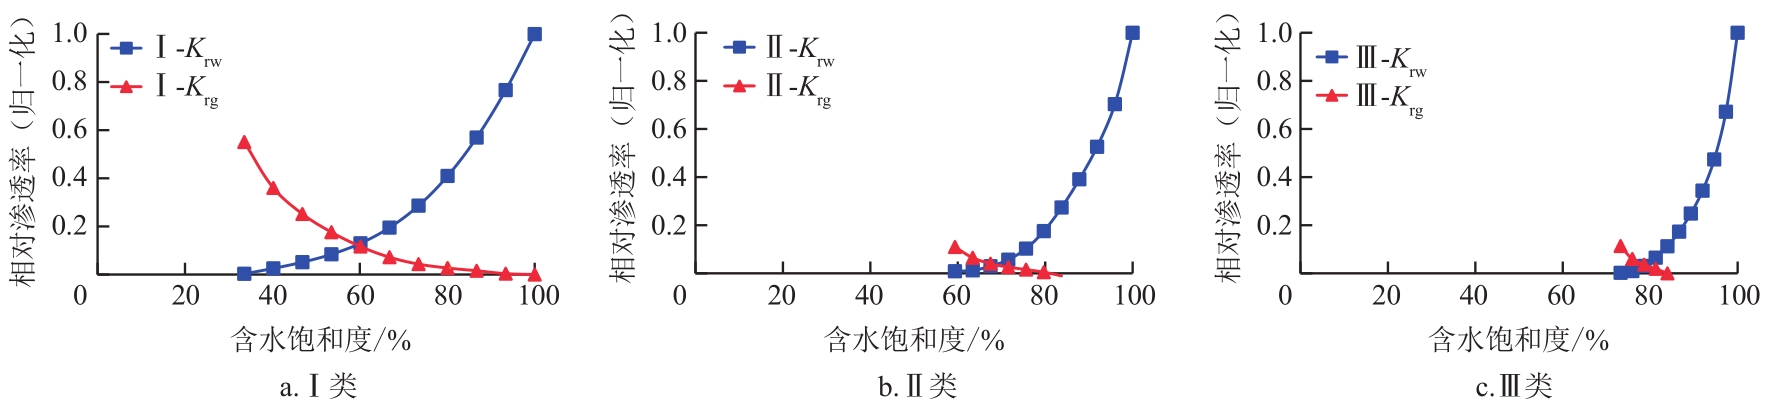
Table 5
Normalized feature point parameters in DJ block"
| 类别 | Swi/% | Krg(Swi) | Sx/% | Kx(Sx) | Sgi/% | Krw(Sgi) |
|---|---|---|---|---|---|---|
| Ⅰ | 33.56 | 0.551 | 58.78 | 0.121 | 0 | 1.000 |
| Ⅱ | 59.35 | 0.110 | 68.25 | 0.023 | 20.32 | 0.176 |
| Ⅲ | 73.23 | 0.114 | 78.93 | 0.028 | 18.74 | 0.065 |
Fig. 7
Relationship between Krg/Krw and water saturation of three types of cores in DJ block"
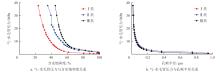
Fig. 8
Relationship between capillary pressure and water saturation in DJ block"
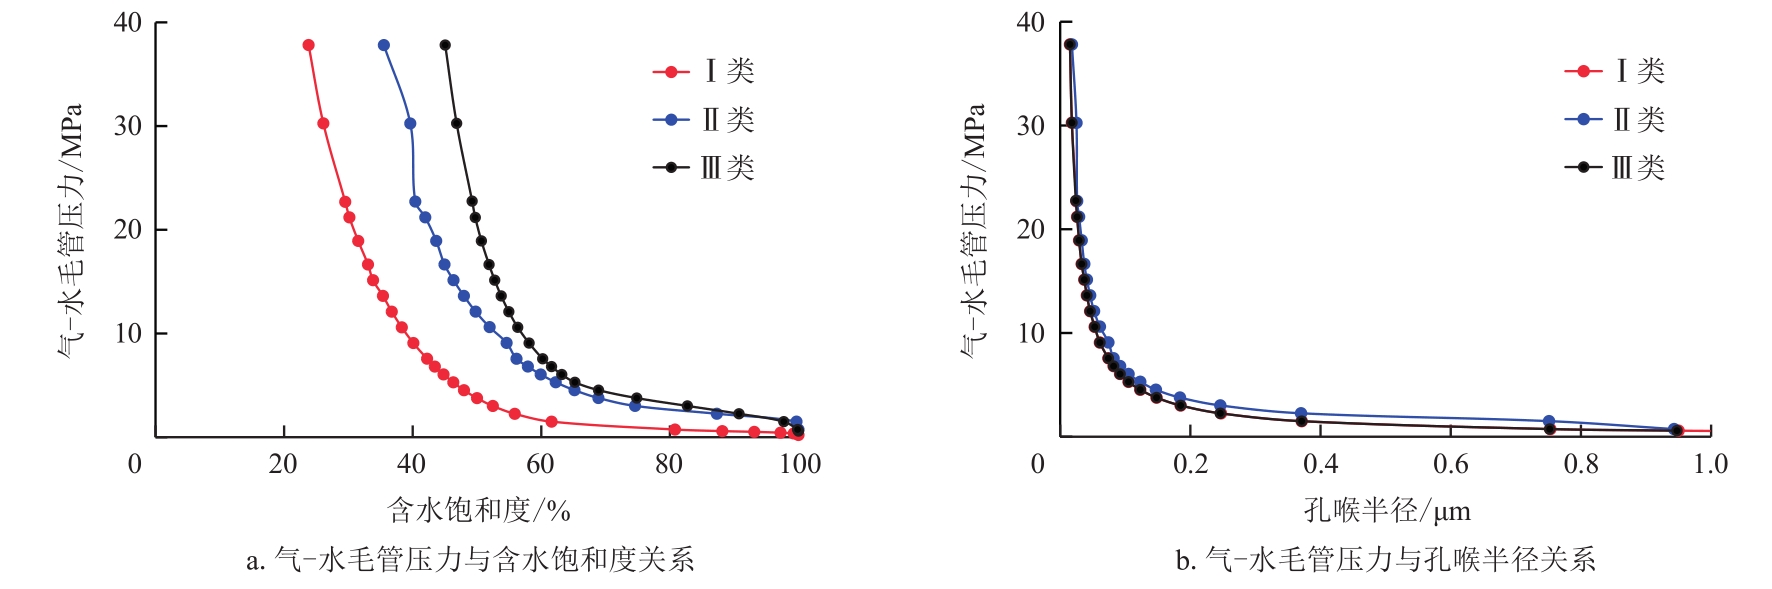
Table 6
Typical gas well parameters corresponding to three types of reservoirs in DJ block"
| 类别 | 井号 | 孔隙度/ % | 渗透率/ 10-3 μm2 | 平均日产 气量/m3 | 平均日产 水量/m3 | 主力 层厚/m |
|---|---|---|---|---|---|---|
| Ⅰ | DJ-A | 12.66 | 1.32 | 10 450.18 | 6.98 | 7.22 |
| Ⅱ | DJ-B | 10.92 | 0.31 | 7 792.74 | 4.27 | 5.01 |
| Ⅲ | DJ-C | 6.11 | 0.12 | 5 874.51 | 1.21 | 5.98 |
Fig. 9
Production curve of well DJ-A in DJ block"

Fig. 10
Production curve of well DJ-B in DJ block"
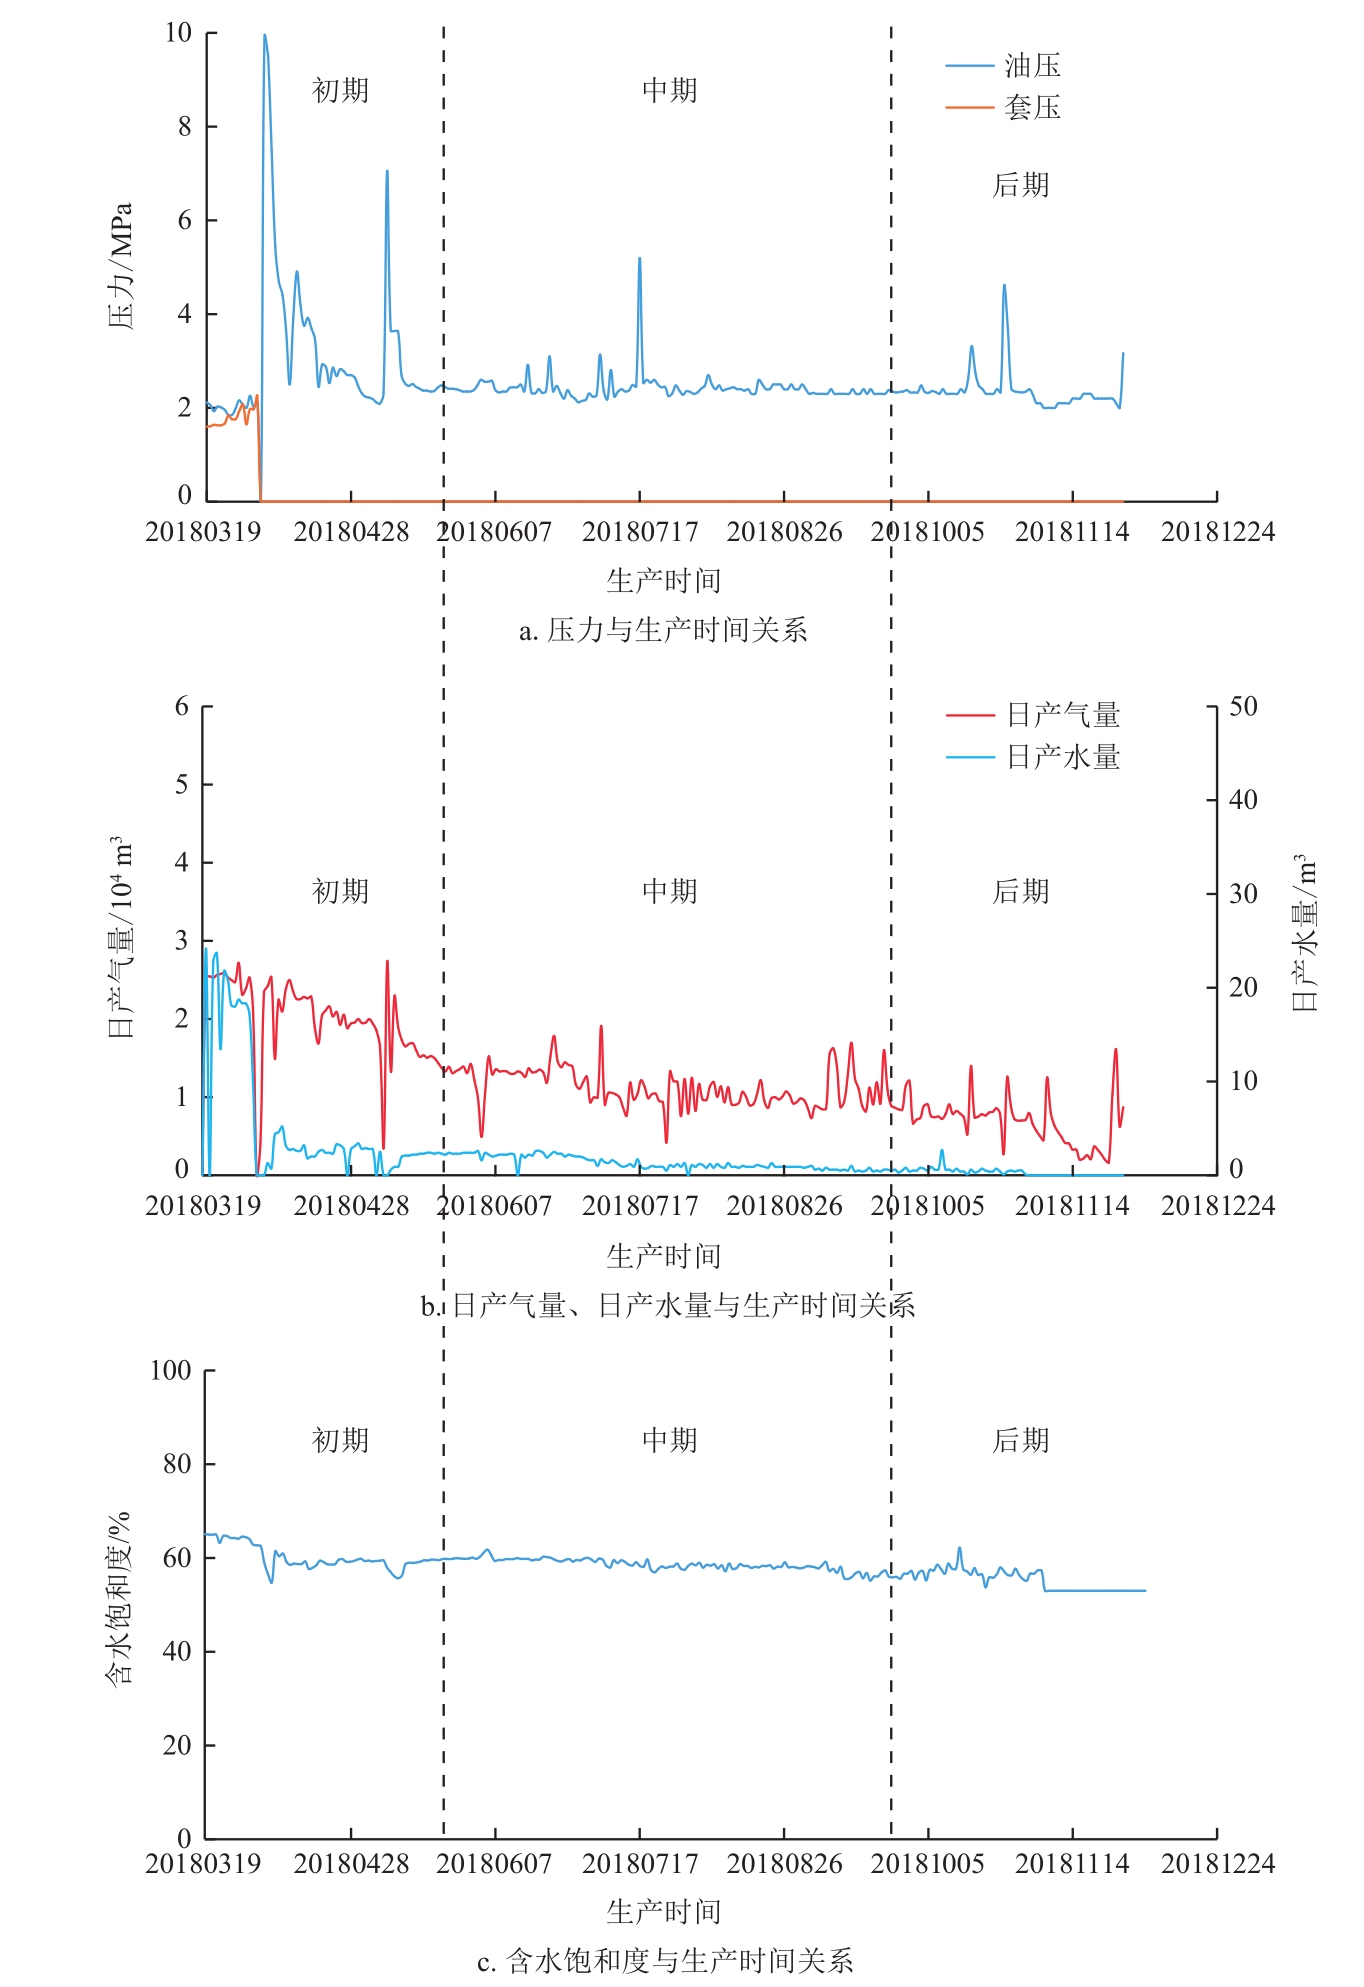
Fig. 11
Production curve of well DJ-C in DJ block"

| [1] | 倪良田, 钟建华, 王桂林, 等. 吐哈盆地水西沟群致密砂岩气成藏机制新理论——近生近储和自生自储[J]. 煤炭科学技术, 2022, 50(3): 176-186. |
| NI Liangtian, ZHONG Jianhua, WANG Guilin, et al. A new gas-accumulation theory of tight sandstone gas accumulation in Turpan-Hami Basin-proximal-generation and proximal-storage type and self-generation and self-storage type[J]. Coal Science and Technology, 2022, 50(3): 176-186. | |
| [2] | 邹才能, 杨智, 董大忠, 等. 非常规源岩层系油气形成分布与前景展望[J]. 地球科学, 2022, 47(5): 1517-1533. |
| ZOU Caineng, YANG Zhi, DONG Dazhong, et al. Formation, distribution and prospect of unconventional hydrocarbons in source rock strata in China[J]. Earth Science, 2022, 47(5): 1517-1533. | |
| [3] | 贾爱林, 位云生, 郭智, 等. 中国致密砂岩气开发现状与前景展望[J]. 天然气工业, 2022, 42(1): 83-92. |
| JIA Ailin, WEI Yunsheng, GUO Zhi, et al. Development status and prospect of tight sandstone gas in China[J]. Natural Gas Industry, 2022, 42(1): 83-92. | |
| [4] | 赵永强, 倪春华, 吴小奇, 等. 鄂尔多斯盆地杭锦旗地区二叠系地层水地球化学特征和来源[J]. 石油实验地质, 2022, 44(2): 279-287. |
| ZHAO Yongqiang, NI Chunhua, WU Xiaoqi, et al. Geochemical characteristics and source of Permian formation water in Hangjinqi area, Ordos Basin[J]. Petroleum Geology & Experiment, 2022, 44(2): 279-287. | |
| [5] | 王伟, 陈朝兵, 许爽, 等. 鄂尔多斯盆地延长组致密砂岩不同尺度孔喉分形特征及其控制因素[J]. 石油实验地质, 2022, 44(1): 33-40. |
| WANG Wei, CHEN Zhaobing, XU Shuang, et al. Fractal characteristics and its controlling factors of pore-throat with different scales in tight sandstones of the Yanchang Formation in the Ordos Basin[J]. Petroleum Geology & Experiment, 2022, 44(1): 33-40. | |
| [6] | WU F, LI Y, BURNHAM B, et al. Fractal-based NMR permeability estimation in tight sandstone: A case study of the Jurassic rocks in the Sichuan Basin, China[J]. Journal of Petroleum Science and Engineering, 2022, 218: 110-118. |
| [7] | 叶礼友, 高树生, 杨洪志, 等. 致密砂岩气藏产水机理与开发对策[J]. 天然气工业, 2015, 35(2): 41-46. |
| YE Liyou, GAO Shusheng, YANG Hongzhi, et al. Water production mechanism and development strategy of tight sandstone gas reservoirs[J]. Natural Gas Industry, 2015, 35(12): 27-34. | |
| [8] | YANG Y B, XIAO W L, BERNABE Y, et al. Effect of pore structure and injection pressure on waterflooding in tight oil sandstone cores using NMR technique and pore network simulation[J]. Journal of Petroleum Science and Engineering, 2022, 217: 110-119. |
| [9] |
祝海华, 张廷山, 钟大康, 等. 致密砂岩储集层的二元孔隙结构特征[J]. 石油勘探与开发, 2019, 46(6): 1220-1228.
doi: 10.11698/PED.2019.06.20 |
|
ZHU Haihua, ZHANG Tingshan, ZHONG Dakang, et al. Binary pore structure characteristics of tight sandstone reservoirs[J]. Petroleum Exploration and Development, 2019, 46(6): 1220-1228.
doi: 10.11698/PED.2019.06.20 |
|
| [10] | LIU G F, XIE S T, TIAN W, et al. Effect of pore-throat structure on gas-water seepage behaviour in a tight sandstone gas reservoir[J]. Fuel, 2022, 3(1): 12-19. |
| [11] | 计玮. 致密砂岩气储层气水相渗特征及其影响因素——以鄂尔多斯盆地苏里格气田陕234-235井区盒8段、山1段为例[J]. 吉林大学学报(地球科学版), 2019, 49(6): 1540-1551. |
| JI Wei. Gas water relative flow of tight sandstone gas reservoirs and its influencing factors: Case study of member 8 of Permian Xiashihezi Formation and member 1 of Permian Shanxi Formation in Shaan Well 234-235 area of Sulige gas field in Ordos Basin[J]. Journal of Jilin University(Earth Science Edition), 2019, 49(6): 1540-1551. | |
| [12] | 董鑫旭, 冯强汉, 王冰, 等. 苏里格西部致密砂岩储层不同孔隙类型下的气水渗流规律[J]. 油气地质与采收率, 2019, 26(6): 36-45. |
| DONG Xinxu, FENG Qianghan, WANG Bing, et al. Gas-water percolation law of tight sandstone reservoirs with different pore types in western Sulige[J]. Petroleum Geology and Recovery Efficiency, 2019, 26(6): 36-45. | |
| [13] | 葛东升, 蔡振华, 刘灵童, 等. 鄂尔多斯盆地东缘临兴地区太原组太2段致密砂岩储层孔隙结构及渗流特征分析[J]. 非常规油气, 2020, 7(6): 11-17. |
| GE Dongsheng, CAI Zhenhua, LIU Lingtong, et al. Analysis on microscopic pore structure and seepage characteristics of tight sandstone reservoir of Tai 2 section of Taiyuan Formation in Linxing area, Ordos Basin[J]. Unconventional Oil & Gas, 2020, 7(6): 11-17. | |
| [14] | LIU G F, WANG Y F, YIN H, et al. Determination of gas-water seepage characteristics with consideration of dynamic pore-throat structure in a tight sandstone gas formation[J]. Marine and Petroleum Geology, 2022, 13(6): 105-126. |
| [15] | ESMAEILI S, SARMA H, HARDING T G, et al. Review of the effect of temperature on oil-water relative permeability in porous rocks of oil reservoirs[J]. Fuel, 2019, 23(7): 91-116. |
| [16] |
ZHANG J, LI X Z, SHEN W J, et al. Study of the Effect of Movable Water Saturation on Gas Production in Tight Sandstone Gas Reservoirs[J]. Energies, 2020, 13(18): 45-46.
doi: 10.3390/en13010045 |
| [17] | YIN X D, SHU J, LI Y L, et al. Impact of pore structure and clay content on the water-gas relative permeability curve within tight sandstones: A case study from the LS block, eastern Ordos Basin, China[J]. Journal of Natural Gas Science and Engineering, 2020, 8(1): 103-124. |
| [18] | 杨玉斌, 肖文联, 韩建, 等. 丹凤场气田致密砂岩气水渗流特征及影响因素[J]. 油气藏评价与开发, 2022, 12(2): 356-364. |
| YANG Yubin, XIAO Wenlian, HAN Jian, et al. Gas-water flow characteristics and influencing factors of tight sandstone in Danfengchang Gas Field[J]. Petroleum Reservoir Evaluation and Development, 2022, 12(2): 356-364. | |
| [19] |
LI Y G, XIAO F, XU W, et al. Performance evaluation on water-producing gas wells based on gas & water relative permeability curves: A case study of tight sandstone gas reservoirs in the Sulige gas field, Ordos Basin[J]. Natural Gas Industry B, 2016, 3(1): 52-58.
doi: 10.1016/j.ngib.2016.02.006 |
| [20] | 刘喜杰, 马遵敬, 韩冬, 等. 鄂尔多斯盆地东缘临兴区块致密砂岩优质储层形成的主控因素[J]. 天然气地球科学, 2018, 29(4): 481-490. |
| LIU Xijie, MA Zunjing, HAN Dong, et al. Research on the main factors of high quality tight sandstone reservoir in Linxing block, Ordos Basin[J]. Natural Gas Geoscience, 2018, 29(4): 481-490. | |
| [21] | 王卓, 赵靖舟, 孟选刚, 等. 鄂尔多斯盆地东南部柴上塬区三叠系延长组长6致密油成藏主控因素及富集规律[J]. 石油实验地质, 2022, 44(2): 251-261. |
| WANG Zhuo, ZHAO Jingzhou, MENG Xuangang, et al. Key controlling factors and enrichment mechanisms of tight reservoirs in 6th member of Triassic Yanchang Formation, Chaishangyuan area, southeastern Ordos Basin[J]. Petroleum Geology & Experiment, 2022, 44(2): 251-261. | |
| [22] | SHARAWY M E, GAAFAR G R. Impacts of petrophysical properties of sandstone reservoirs on their irreducible water saturation: Implication and prediction[J]. Journal of African Earth Sciences, 2019, 15(6): 118-132. |
| [23] | PENG L, ZHANG C, MA H L, et al. Estimating irreducible water saturation and permeability of sandstones from nuclear magnetic resonance measurements by fractal analysis[J]. Marine and Petroleum Geology, 2019, 11(6): 565-574. |
| [24] | 孙雅雄, 张坦, 丁文龙, 等. 压汞法与数字图像分析技术在致密砂岩储层微观孔隙定量分析中的应用——以鄂尔多斯盆地吴起油田X区块为例[J]. 石油实验地质, 2022, 44(6): 1105-1115. |
| SUN Yaxiong, ZHANG Tan, DING Wenlong, et al. Application of mercury intrusion method and digital image analysis in quantitative analysis of micro-scale pores in tight sandstone reservoirs: a case study of X block in Wuqi Oil Field, Ordos Basin[J]. Petroleum Geology & Experiment, 2022, 44(6): 1105-1115. | |
| [25] | CHENG Y, ZHANG C, ZHU L Q. A fractal irreducible water saturation model for capillary tubes and its application in tight gas reservoir[J]. Journal of Petroleum Science and Engineering, 2017, 15(9): 731-739. |
| [26] | QIAO J C, ZENG J H, CHEN D X, et al. Permeability estimation of tight sandstone from pore structure characterization[J]. Marine and Petroleum Geology, 2022, 13(5): 105-116. |
| [27] | 孔星星, 肖佃师, 蒋恕, 等. 联合高压压汞和核磁共振分类评价致密砂岩储层——以鄂尔多斯盆地临兴区块为例[J]. 天然气工业, 2020, 40(3): 38-47. |
| KONG Xingxing, XIAO Dianshi, JIANG Shu, et al. Application of the combination of high-pressure mercury injection and nuclear magnetic resonance to the classification and evaluation of tight sandstone reservoirs: A case study of the Linxing Block in the Ordos Basin[J]. Natural Gas Industry, 2020, 40(3): 38-47. | |
| [28] | 李跃刚, 肖峰, 徐文, 等. 基于气水相对渗透率曲线的产水气井开采效果评价——以苏里格气田致密砂岩气藏为例[J]. 天然气工业, 2015, 35(12): 27-34. |
| LI Yuegang, XIAO Feng, XU Wen, et al. Performance evaluation on water-producing gas wells based on gas-water relative permeability curves: A case study of tight sandstone gas reservoirs in the Sulige Gas Field, Ordos Basin[J]. Natural Gas Industry, 2015, 35(12): 27-34. | |
| [29] | 潘婷婷, 张枫, 邢昆明, 等. 不同储层相对渗透率曲线归一化方法评价[J]. 大庆石油地质与开发, 2016, 35(3): 78-82. |
| PAN Tingting, ZHANG Feng, XING Kunming, et al. Evaluation of the relative-permeability-curve normalizing method for the different reservoirs[J]. Petroleum Geology & Oilfield Development in Daqing, 2016, 35(3): 78-82. | |
| [30] | 马云峰, 赵建国, 孙龙, 等. 应力作用下气藏水体微观赋存特征及渗流规律——以鄂尔多斯盆地神木气田二叠系盒8段致密储层为例[J]. 石油实验地质, 2023, 45(3): 466-473. |
| MA Yunfeng, ZHAO Jianguo, SUN Long, et al. Microscopic occurrence characteristics and seepage law of water bodies in gas reservoir under stress:a case study of tight reservoirs in the eighth member of Permian Shihezi Formation, Shenmu Gas Field, Ordos Basin[J]. Petroleum Geology & Experiment, 2023, 45(3): 466-473. | |
| [31] | 何晨毓, 刘丽琼, 肖玉茹, 等. 鄂尔多斯盆地红河油田长8油藏效益开发地质评价参数的确定[J]. 石油实验地质, 2023, 45(4): 791-796. |
| HE Chenyu, LIU Liqiong, XIAO Yuru, et al. Determination of geological evaluation parameters for profitable development of Chang 8 tight oil reservoir in Honghe oil field, Ordos Basin[J]. Petroleum Geology & Experiment, 2023, 45(4): 791-796. |
| [1] | ZHAO Di, MA Sen, CAO Yanhui. Seismic rock physics analysis and prediction model establishment of Shaximiao Formation in Zhongjiang Gas Field [J]. Petroleum Reservoir Evaluation and Development, 2023, 13(5): 608-613. |
| [2] | WANG Xiaoming,CHEN Junbin,REN Dazhong. Research progress and prospect of pore structure representation and seepage law of continental shale oil reservoir [J]. Reservoir Evaluation and Development, 2023, 13(1): 23-30. |
| [3] | ZHAO Lan. Development characteristics of microfractures in tight sandstone reservoir and its influence on physical properties: A case study of Shiligiahan zone in Hangjinqi [J]. Reservoir Evaluation and Development, 2022, 12(2): 285-291. |
| [4] | HAN Lei,LIU Junzhou,YANG Rui,ZHANG Guangzhi,ZHOU You. Application of pre-stack elastic impedance inversion method based on VTI medium: A case of tight sandstone fractured reservoir in Xujiahe Formation, Western Sichuan Depression [J]. Reservoir Evaluation and Development, 2022, 12(2): 313-319. |
| [5] | YOU Lijun,WANG Yang,KANG Yili,TANG Jirui,LIU Jiang,YANG Dongsheng. Physical properties of water-bearing tight sandstone reservoir for improving permeability by thermal stimulation [J]. Reservoir Evaluation and Development, 2022, 12(2): 320-328. |
| [6] | TANG Botao,ZENG Ji,CHEN Weihua,CHEN Yixin,WANG Tao,LIU Cheng,FENG Feng. Multi cluster perforation optimization design method and its application effect of tight sandstone horizontal wells in Qiulin area, central Sichuan [J]. Reservoir Evaluation and Development, 2022, 12(2): 337-344. |
| [7] | LIU Chengchuan,WANG Yongfei,BI Youyi. Efficient development technique of tight sandstone gas reservoir in narrow channel of Zhongjiang Gas Field [J]. Reservoir Evaluation and Development, 2022, 12(2): 345-355. |
| [8] | YANG Yubin,XIAO Wenlian,HAN Jian,GOU Ling,LI Min,ZHOU Keming,OUYANG Mukun,CHEN Li. Gas-water flow characteristics and influencing factors of tight sandstone in Danfengchang Gas Field [J]. Reservoir Evaluation and Development, 2022, 12(2): 356-364. |
| [9] | LIU Shugen, RAN Bo, YE Yuehao, WANG Shiyu, YANG Di, LUO Chao, HAN Yuyue, SONG Jinmin, ZHANG Xuan. Outcrop of Ordovician Wufeng Formation-Silurian Longmaxi Formation in Qilong Village, Xishui, Guizhou [J]. Reservoir Evaluation and Development, 2022, 12(1): 10-28. |
| [10] | WANG Yingwei,WU Shunwei,QIN Jianhua,YE Yiping,GAO Yang,ZHANG Jing. Effects of supercritical CO2 immersion on permeability of sandy conglomerate reservoir with different clay mineral content in Mahu [J]. Petroleum Reservoir Evaluation and Development, 2021, 11(6): 837-844. |
| [11] | LIU Lu,WANG Yongfei,ZHAN Zedong,XIE Jinfeng. Main control factors of horizontal wells in J2s2 tight sandstone gas reservoir of Xinchang Gas Field [J]. Petroleum Reservoir Evaluation and Development, 2021, 11(6): 890-896. |
| [12] | SUN Cangjun,HUANG Lei,WU Haojun,JIANG Yong,WANG Di. Acid sensitivity evaluation of ultra-low permeability reservoir in structure-B of Bohai Bay [J]. Petroleum Reservoir Evaluation and Development, 2021, 11(5): 703-708. |
| [13] | SONG Wenhui,LIU Lei,SUN Hai,ZHANG Kai,YANG Yongfei,YAO Jun. Pore structure characterization and flow ability of shale oil reservoir based on digital cores [J]. Petroleum Reservoir Evaluation and Development, 2021, 11(4): 497-505. |
| [14] | CHEN Mingjiang,LIU Junhai,CHENG Liang. Identification of fluid type and fine characterization of oil-water contact for an oil reservoir with strong vertical heterogeneity [J]. Petroleum Reservoir Evaluation and Development, 2021, 11(3): 428-436. |
| [15] | XIONG Liang,PANG Heqing,ZHAO Yong,WEI Limin,ZHOU Hua,CAO Qian. Micro pore structure characterization and classification evaluation of reservoirs in Weirong Deep Shale Gas Field [J]. Reservoir Evaluation and Development, 2021, 11(2): 154-163. |
|